
Co-Author Tyler Sauerteig
In partnership with the Worldwide Intranet Challenge, we’ve applied econometric principles to the results of over 200 intranet surveys and… statistically pinpointed which intranet attributes most impact a user’s perception of their intranet.
This first post in this seven week series is focused on the data analysis of “look” factors — showing what employees prefer to look and find when they view their company’s intranet.
[vc_separator type=’transparent’ position=’center’ color=” thickness=’10’ up=” down=”]
Two Things Employees Want Their Intranet To Do
[vc_separator type=’transparent’ position=’center’ color=” thickness=’10’ up=” down=”]
- Help them understand the values and culture of their organization
- Have content labelled with an owner
[vc_separator type=’transparent’ position=’center’ color=” thickness=’10’ up=” down=”]
These findings are based on Worldwide Intranet Challenge survey participants rating the importance of the following statements about the “Look and Feel” of their company’s intranet.
[vc_separator type=’transparent’ position=’center’ color=” thickness=’5′ up=” down=”]
- I like the intranet homepage
- I like the look and feel of the intranet
- Information on the intranet is easy to read
- The intranet has a consistent page layout
- Content is labelled with an owner
- I can personalize the intranet
- The intranet helps me understand our values & culture
[vc_separator type=’transparent’ position=’center’ color=” thickness=’5′ up=” down=”]
I was actually kind of surprised by these findings. I personally would have placed “consistent page layout” and “ability to personalize” as having a bigger impact on how highly users rank their intranet. In fact, not only was I wrong about personalization having a positive impact, our study showed that:
[vc_separator type=’transparent’ position=’center’ color=” thickness=’10’ up=” down=”]
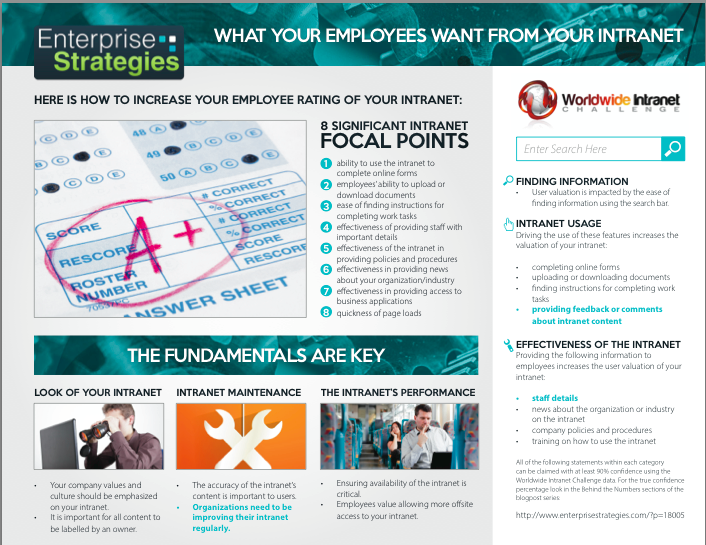 Free Download: What Your Employees Want From Your Intranet
[vc_separator type=’transparent’ position=’center’ color=” thickness=’2′ up=” down=”]
In this download, you will find the following information:
- Ways to increase your employees’ rating of your company’s intranet
- How to invest your intranet redesign money to get the biggest return
- Key intranet fundamentals to ensure employee engagement
[vc_separator type=’transparent’ position=’center’ color=” thickness=’5′ up=” down=”]
[button size=” style=” text=’Get Your Free Download’ icon=” icon_color=” link=’/what-your-employees-want-from-your-intranet/’ target=’_self’ color=” hover_color=” border_color=” hover_border_color=” background_color=” hover_background_color=” font_style=” font_weight=” text_align=” margin=”]
[vc_separator type=’transparent’ position=’center’ color=” thickness=’30’ up=” down=”]
[vc_separator type=’transparent’ position=’center’ color=” thickness=’5′ up=” down=”]
Being able to personalize the company intranet actually has a negative impact on the way that employees value their intranet.
[vc_separator type=’transparent’ position=’center’ color=” thickness=’5′ up=” down=”]
On further reflection, this makes sense. “Too much choice” has been scientifically proven to create the neurological response of “unhappiness” in we humans. In fact, this was one of the research items I covered in my talk at the 2012 ThoughtFarmer Social Intranet Summit (please hold all comments on chosen hairstyle and attire that day, I promise it was appropriate).
[vc_separator type=’transparent’ position=’center’ color=” thickness=’5′ up=” down=”]
Do you agree?
[vc_separator type=’transparent’ position=’center’ color=” thickness=’5′ up=” down=”]
Are you surprised by these findings? Which attributes would you rank the highest? I genuinely look forward to your comments. I think there is a good discussion to be had here.
To see the details on how we came to the above conclusions, please grab a (strong) cup of coffee and read the following section.
[vc_separator type=’transparent’ position=’center’ color=” thickness=’10’ up=” down=”]
Behind the Numbers
[vc_separator type=’transparent’ position=’center’ color=” thickness=’10’ up=” down=”]
The econometric issues of specification error, serial correlation, and heteroskedasticity are all accounted for within our data set.
[vc_separator type=’transparent’ position=’center’ color=” thickness=’10’ up=” down=”]
Understanding What The Coefficient & P-Value Tell Us
[vc_separator type=’transparent’ position=’center’ color=” thickness=’10’ up=” down=”]
This chart below shows the coefficient and the p-value for each statement within the category “rate the following statements on the look of the intranet.” The coefficients tell us how much the rating of the intranet in the valuation question, “In general, I would rate the intranet as,” changes for a one ranking change in each question. The p-value tells us the confidence level that we could conclude that the sign on the coefficient is correct. In other words, if the coefficient was positive and the p-value was 0.10, we could conclude the question positively affects the valuation of your intranet with 90% confidence. As a general rule of thumb in statistics, a p-value of 0.10 or 90% confidence is generally where the cut off is for claiming a variable is statistically significant.
Statement
|
Coefficient |
P-Value |
| I like the intranet homepage | 0.357 | 0.160 |
| I like the look and feel of the intranet | -0.105 | 0.720 |
| Information on the intranet is easy to read | -0.062 | 0.608 |
| The intranet has a consistent page layout | -0.019 | 0.890 |
| Content is labelled with an owner | 0.148 | 0.097 |
| I can personalize the intranet | -0.187 | 0.031 |
| The intranet helps me understand our values and culture | 0.259 | 0.018 |
[vc_separator type=’transparent’ position=’center’ color=” thickness=’360′ up=” down=”]
Adjusted R2: 0.160
- The adjusted-R2 value tells us that 16% of the variance in the valuation of the intranet is described by the questions within the category of statements on the look of the intranet.
[vc_separator type=’transparent’ position=’center’ color=” thickness=’10’ up=” down=”]
P-Value Tests:
[vc_separator type=’transparent’ position=’center’ color=” thickness=’10’ up=” down=”]
The questions that we found to be most important to your employees based on the look of your intranet were the statements of, content is labelled with an owner and the intranet helps me understand our values and culture. Also, the ability to personalize your intranet was found to actually decrease the rating that people place on their intranet through the study.
[vc_separator type=’transparent’ position=’center’ color=” thickness=’5′ up=” down=”]
- With 90% confidence we can conclude that having content on your intranet being labelled with an owner, increases the valuation ranking that your company’s intranet received.
- With 98% confidence we can conclude that the intranet helping people understand the values and culture of the organization increases the valuation ranking that your company’s intranet received.
- With 96.5% confidence we can conclude that being able to personalize the company intranet actually has a negative impact on the way that employees value their intranet.
[vc_separator type=’transparent’ position=’center’ color=” thickness=’10’ up=” down=”]
Interpretation Of The Coefficients:
[vc_separator type=’transparent’ position=’center’ color=” thickness=’10’ up=” down=”]
- When looking at only the look and feel statements, given that your answer to the WIC statement “I like the intranet home page” was ranked one rating higher (better) in the WIC ranking system for that statement, the way that you were ranked in the rating of your intranet in the valuation question “In general, I would rate the intranet as” was, on average, .357 ranks higher (better), holding all other variables constant.
- When looking at only the look and feel statements, given that your answer to the WIC statement “I can personalize the intranet” was ranked one rating higher (better) in the WIC ranking system for that statement, the way that you were ranked in the rating of your intranet in the valuation statement “In general, I would rate the intranet as” was, on average, 0.187 ranks lower (worse), holding all other variables constant.
[vc_separator type=’transparent’ position=’center’ color=” thickness=’5′ up=” down=”]
For those that are not found statistically significant, you can still interpret their coefficients because the data sheds light on them being positive or negative for the given data set. However, this is with little confidence and makes it a very risky move to focus on something not statistically significant for your intranet re-build or creation.
We hope you gained insights about your intranet look and what really helps your employees become more engaged on your company intranet. Our next blog post will deal with the statements in the category of finding information on your intranet.
[vc_separator type=’transparent’ position=’center’ color=” thickness=’10’ up=” down=”]